Tutorial 3
Question 1
Corrected 29/10/21
As a train accelerates out of the station, its position is measured as follows:
time (s): |
0 |
1 |
2 |
3 |
4 |
5 |
6 |
|---|---|---|---|---|---|---|---|
position (m): |
0 |
0.15 |
0.61 |
1.35 |
2.40 |
3.75 |
5.41 |
Create two lists
timeandpositionto store the data then plot a line graph showing the train’s position against time. Add a titleTrain Positionand axis labelsTime (s)andPosition (m).Using the forumla \(s =\frac{1}{2}at^2\), create a list
pos_estcontaining the position of the train for each time point. Assume that \(a=0.2~\mathrm{m/s^2}\).Plot
pos_eston the graph. By varying \(a\), estimate the acceleration of the train.
Question 2
Given a list of numbers, a moving average is a list containing the mean of n consecutive elements. For example, if x = [1, 2, 3, 4] and n = 2 then the moving average of x is [1.5, 2.5, 3.5].
The variable pressure_data is a list of atmospheric pressure readings in millibars.
Create a second variable pressure_smoothed which contains the the moving average of pressure_data with n = 2 and plot the two lists on a graph. (The two lists will not be the same length so you will have to determine what to do about that!)
Challenge: Adapt your code for an arbitrary value of n.
pressure_data = [1018.3, 1018.3, 1015.7, 1014.3, 1011.8, 1011.4, 1015.5, 1016.0, 1016.9, 1016.8, 1016.4, 1017.5, 1018.8, 1018.1, 1017.1, 1018.4, 1022.0, 1022.8, 1021.8, 1020.5, 1021.0, 1019.8, 1018.9, 1018.4, 1017.8, 1018.1, 1019.6, 1017.4, 1015.8, 1015.5, 1017.5, 1018.9, 1017.7, 1014.4, 1014.2, 1016.0, 1016.1, 1015.6, 1016.4, 1015.7, 1016.6, 1019.6, 1021.6, 1021.4, 1020.6, 1017.6, 1016.5, 1016.2, 1013.0, 1005.4, 1007.4, 1012.2, 1015.2, 1016.1, 1014.3, 1012.4, 1014.2, 1013.1, 1012.9, 1012.1, 1010.6, 1010.0, 1010.5, 1010.3, 1007.4, 1008.9, 1007.4, 1006.9, 1009.8, 1014.8, 1014.9, 1016.6, 1014.1, 1011.1, 1010.7, 1009.8, 1011.9, 1012.6, 1011.8, 1009.8, 1008.9, 1010.6, 1009.9, 1010.2, 1009.5, 1009.0, 1007.1, 1007.1, 1007.5, 1005.0, 1004.2, 1004.2, 1007.2, 1005.0, 1002.9, 1007.4, 1010.4, 1010.6, 1008.6, 1006.2, 1005.9, 1006.8, 1004.6, 1002.4, 1003.2, 1004.4, 1003.1, 1000.9, 998.6, 999.9, 1001.6, 1002.1, 1004.1]
Question 3
Given a string representing a DNA sequence, we want to print a sequence of nucleotide names:
dna_seq = "gttccccaagctcttacataaatgtcgtagggttccagctacgtgttgttgggccaccca"
Output:
Guanine
Thymine
Thymine
Cytosine
...
Create two lists
letters = ["A", "G", "C", "T"]andnames = ["Adenine", "Guanine", "Cytosine", "Thymine"]Loop over every character in
dna_seq. For each character:Find the index of the character in
lettersPrint the item in the equivalent position in
names
HINT: First try just for a single letter. E.g. given nuc = "A", print Adenine.
Question 4 (Optional Challenge)
A cannon located at position x = 0 fires a cannonball at an angle theta from the horizontal (measured in radians) and speed speed m/s. Write a program which plots a graph of the cannonball’s trajectory.
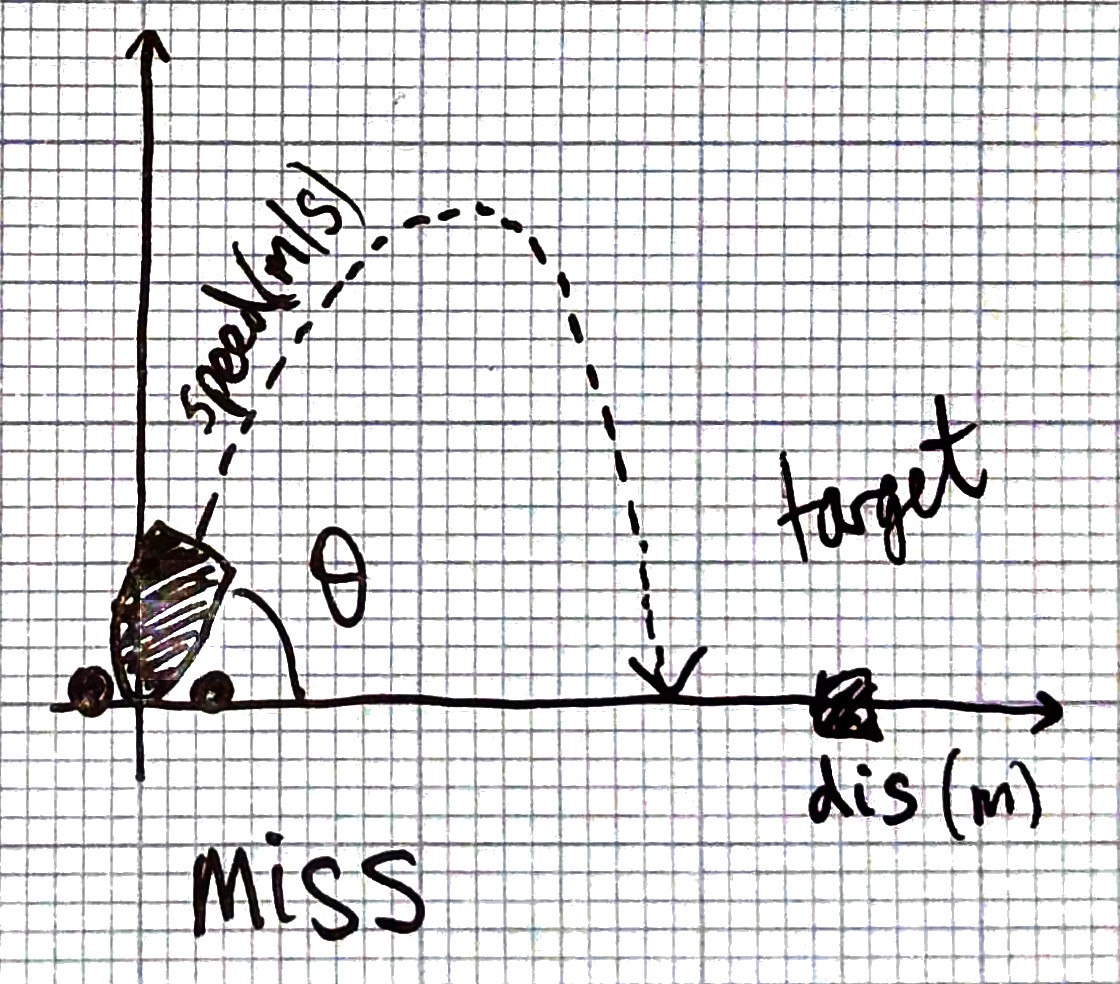
Set the initial positions x and y to zero and velocities vx and vy to np.cos(theta) and np.sin(theta). Each time step, update the positions using x = x + vx * DELTA_T and y = y + vy * DELTA_T. Update the velocity vy = vy - g * DELTA_T. The x velocity remains constant.
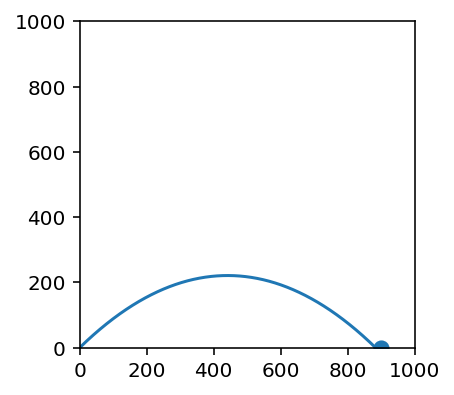
Create lists x_list and y_list to store the x and y positions, appending the new positions at each timestep.
Repeat until the y position becomes negative (what kind of loop should you use for this?). Finally, use matplotlib to plot the two lists.
Extend your program so that it prints hit or miss depending if the cannonball lands less than 20m from a target placed at a distance dis from the cannon.
hit