
2. Graphs with Python
The Python package NetworkX has many functions for manipulating and investigating graphs. For example, the following code demonstrates two ways to create a graph representing a directed 3-cycle.
import networkx as nx
import matplotlib.pyplot as plt
import numpy as np
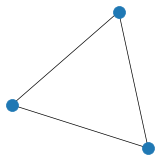
# Create and plot undirected graph using edge list
G1 = nx.Graph()
edge_list = [(0, 1), (1, 2), (2, 0)]
G1.add_edges_from(edge_list)
plt.figure(figsize=(3,3), dpi=25)
nx.draw(G1)
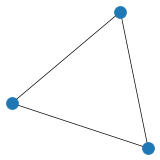
# Create and plot undirected graph using adjacency matrix

adj_matrix = np.array([[0, 1, 0],
                      [0, 0, 1],
                      [1, 0, 0]])
G2=nx.from_numpy_matrix(adj_matrix)
plt.figure(figsize=(3,3), dpi=25)
nx.draw(G2)
The following tutorial is a good starting point for understanding how to use NetworkX:
https://networkx.org/documentation/stable/tutorial.html
Refer to the following URL for more the full documentation:
2.1. Question 1
Use NetworkX to plot a directed graph of the egg-laying circuit.
2.2. Question 2
A (Erdos-Renyi) random graph \(G_{N,p}\) is an undirected graph with \(N\) nodes where the probability of an edge between any two nodes is \(p\).
Use NetworkX to estimate the global clustering coefficient and average path length of \(G_{10,0.5}\).
Write a function which returns an undirected random graph with \(N\) nodes and expected (average) node degree \(k\).
For fixed average node degree \(k\), how does average path length and global clustering vary with graph size? Choose a value of \(k\), and plot average path length against \(N\) and global clustering against \(N\). Describe what you find.