Lists and Plotting
What you’ll learn
How to store a sequence of data in a
listHow to traverse lists
How to add and remove elements
How find elements
Plotting graphs using
matplotlib
Example
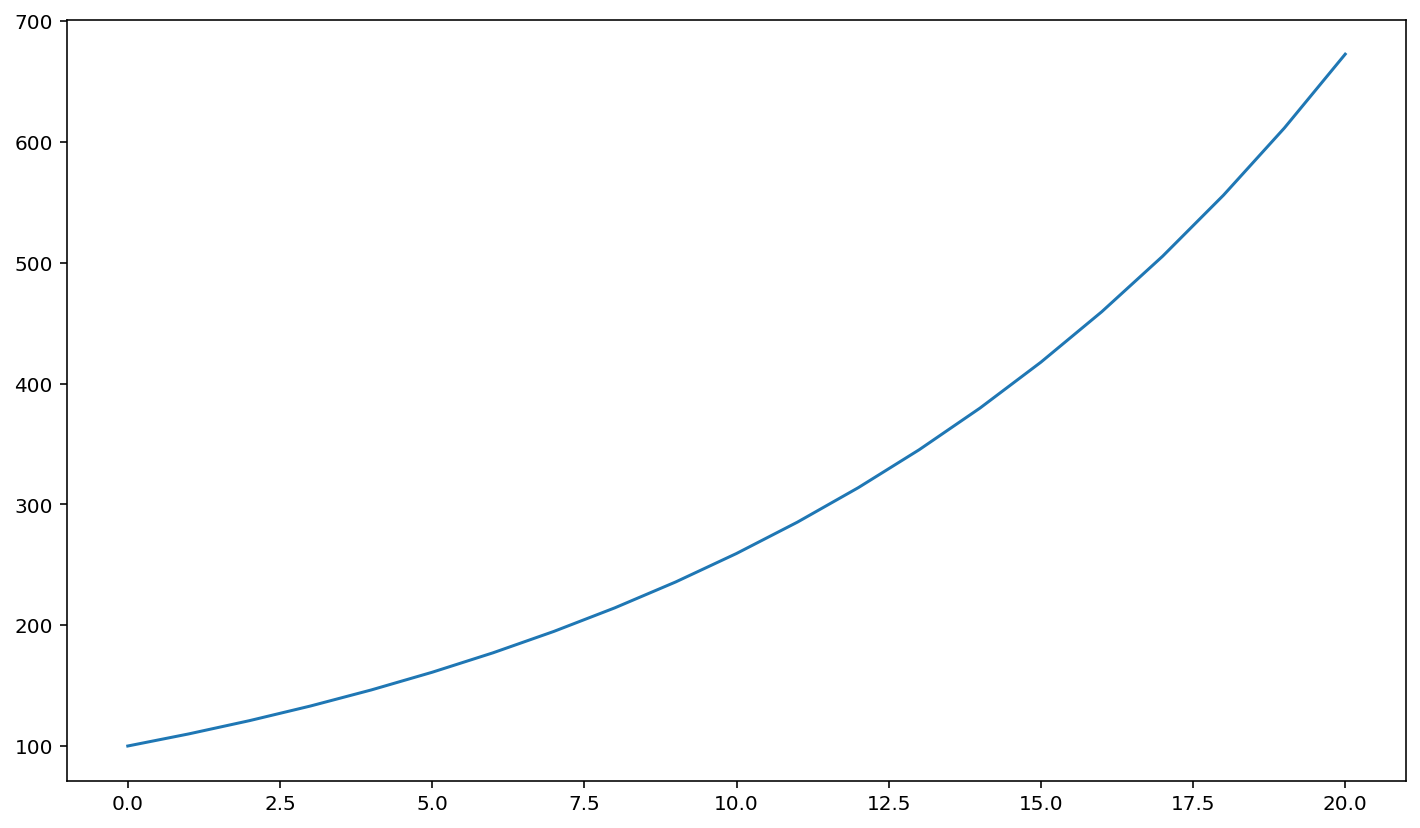
Recall in week one we simulated the exponential growth of a population of bacteria. We were able to predict the size of the population at any time by iteratively applying a growth rule (in this case, multiplication by a constant factor).
In the example below, we do the same simulation, except this time we keep track of the population at every time point by storing it in a list. Furthermore, we then use a Python library called matplotlib to plot the results as a line graph.
import matplotlib.pyplot as plt

pop = 100
r = 1.1
n = 10

pop_list = [pop]

for i in range(20):
    pop = pop * r
    pop_list.append(pop)

print(pop_list)

plt.plot(pop_list)
[100, 110.00000000000001, 121.00000000000003, 133.10000000000005, 146.41000000000008, 161.0510000000001, 177.15610000000012, 194.87171000000015, 214.3588810000002, 235.79476910000022, 259.37424601000026, 285.3116706110003, 313.84283767210036, 345.2271214393104, 379.74983358324147, 417.7248169415656, 459.49729863572225, 505.4470284992945, 555.991731349224, 611.5909044841464, 672.7499949325611]
[<matplotlib.lines.Line2D at 0x7f2367ea4b20>]

There are three new concepts here that we will explore in more detail. Firstly, we import a library called matplotlib which contains plotting functions:
import matplotlib.pyplot as plt
Secondly, we use a new data type called a list which allows us to store a sequence of values:
pop_list = [pop]
Thirdly, we use the imported matplotlib library to plot a graph:
plt.plot(pop_list)
Lists
A list is a Python data type that stores a sequence of values. For example, suppose we have the following data representing five years’ population data:
populations = [12, 25, 54, 102, 206]
print(populations)
[12, 25, 54, 102, 206]
Each element in a list has an index which identifies its position. We can access a list element by following the variable name with square brackets and the index:
initial_pop = populations[0]
year_3_pop = populations[3]

print("Initial population:", initial_pop)
print("Population in year 3:", year_3_pop)
Initial population: 12
Population in year 3: 102
Likewise, we can update individual list elements. Suppose we would like to change the value of the 3rd element:
populations[3] = 100 # Assign the value 100 to element at index 3
print(populations)
[12, 25, 54, 100, 206]
Any data type can be stored in a list, including strings:
cities = ["Manchester", "Liverpool", "Sheffield", "Stoke-on-Trent"]
x = cities[2]
print(x)
Sheffield
Note
Lists are indexed starting from
0. If a list hasnelements, then the last element is at indexn - 1.Square brackets are used for two distinct purposes: for list creation:
x = [1, 2, 4], and list element access:x[2].
Traversing Lists
There are two ways of accessing all elements of a list. The first way is to use a for loop to loop over all index values. We use the Python function len to determine the number of elements in the list.
n = len(populations) # get the number of elements in the list
for i in range(n): # loop over index values 0 to n - 1
    pop = populations[i] # Access element at index i
    print("Year", i, "population:", pop)
Year 0 population: 12
Year 1 population: 25
Year 2 population: 54
Year 3 population: 100
Year 4 population: 206
If you don’t need index values, you can loop over the individual elements of the list:
for pop in populations: # loop over all elements of the list
    print("Population:", pop)
Population: 12
Population: 25
Population: 54
Population: 100
Population: 206
Appending Elements to a List
After a list is created, we can add items to it using the append method. Suppose that we have recorded the species population for the next year as 420:
populations.append(420)
print(populations)
[12, 25, 54, 100, 206, 420]
A common pattern for list creation is to start with an empty list, then use a loop to append one element at a time. The following example creates a list of the first 10 square numbers.
values = []
for i in range(10):
    values.append(i**2)
print(values)
[0, 1, 4, 9, 16, 25, 36, 49, 64, 81]
Finding a List Element
If you want to know the index of an element in a list, use the index method. string.index(s) returns the first element equal to argument s:
values = ["ABC", "DEF", "GHI", "JKL"]
i = values.index("GHI") # Find the index of the first element equal to "GHI"
print(i)
2
Plotting using Matplotlib
Python does not include any in-built graph plotting capability. In order to plot graphs, we have to import a Python package called matplotlib. A package is a library of code which we can use to extend the capabilities of core Python, and is composed of individual code files called modules. Use the import statement to import the module matplotlib.pyplot:
import matplotlib.pyplot as plt
Note
The Python statement
import acauses the Python package (or module)ato be imported. Any function defined inais then available by typing ‘a.’ followed by the function name.import a as bgivesaan alias (nickname)b, so that functions are available by typing ‘b.’ followed by the function name. This is useful whenahas a long name (such asmatplotlib.pyplot).Python includes built-in modules such as
sys(system functions) andos(operating system functions) which can be imported in the same way.Other packages are not part of Python itself but are pre-installed as part of a Python distribution (such as Anaconda or Cocalc). In this course we will use
matplotlibandnumpy.There are many third-party modules available, which typically need to be downloaded and installed. Examples include
biopython(for bioinformatics) andpandas(for data analysis).
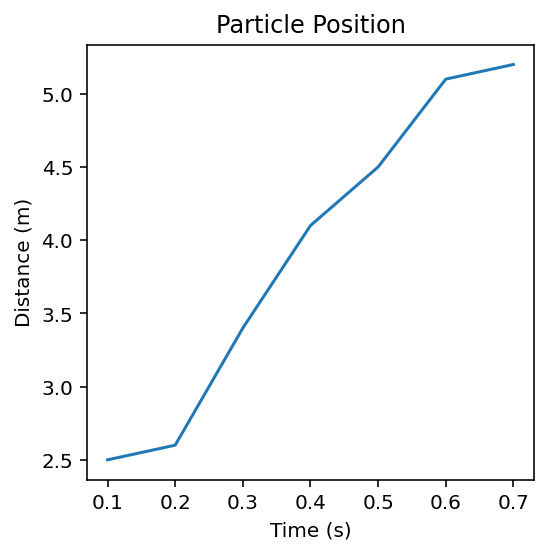
Suppose we have collected the following data which we would like to plot on a line graph.
Time (s) |
0.1 |
0.2 |
0.3 |
0.4 |
0.5 |
0.6 |
0.7 |
|---|---|---|---|---|---|---|---|
Distance (m) |
2.5 |
2.6 |
3.4 |
4.1 |
4.5 |
5.1 |
5.2 |
First, we create lists to store the data for each of the x-axis and y-axis:
time = [0.1, 0.2, 0.3, 0.4, 0.5, 0.6, 0.7]
dis = [2.5, 2.6, 3.4, 4.1, 4.5, 5.1, 5.2]
Then:
create a figure using the function
plt.figure, passing in the dimensions in inches.plot a line graph using
plt.plot, passing in the two listsadd axis labels and a title using
plt.xlabel,plt.ylabelandplt.title
plt.figure(figsize=(4,4)) # create figure of size 4 by 4 inches
plt.plot(time, dis) # plot a line graph
plt.xlabel("Time (s)") # add an x-axis label
plt.ylabel("Distance (m)") # add a y-axis label
plt.title("Particle Position") # add a figure title
Text(0.5, 1.0, 'Particle Position')

String Iteration
A for loop can be used to iterate over any container data type. Container data types include lists, which will be introduced next week, as well as strings, we will be explored further the following week. For now, just note that a string consists of a sequence of characters, and therefore it is possible to iterate over it using a for loop.
We can use this to count characters in a string. For example, how many w’s are there in this sentence?
text = "We can use this to count characters in a string. For example, how many w's are there in this sentence?"

counter = 0 # Set the counter to zero
for c in text: # Loop over each character in the text
    if c == "w": # Check if the character is "w"
        counter = counter + 1 # If so, increase the counter

print("Number of w's:", counter)
Number of w's: 2
Note
Strings are not equal if they are of a different case, so "W" == "w" is not true
Errors
Python expects code to have a very specific format. For example, every open bracket ‘(‘ must have a matching closing bracket ‘)’. If there is an error in the code, python will generate an error message.
print("***"
  File "/tmp/ipykernel_2741/2048779763.py", line 1
    print("***"
               ^
SyntaxError: unexpected EOF while parsing
The error message tells us that the error is on line 1 and that the type of error is SyntaxError.
This information can be very useful, especially in longer programs.
print("This")
print("code")
print("works)
print("perfectly!")
  File "<ipython-input-13-c77efdeb2804>", line 3
    print("works)
                 ^
SyntaxError: EOL while scanning string literal
The error is on line 3. To view line numbers change to command mode (press Esc) then press the l key. Now we can see that the error is on line 3 and we can fix it by putting in the missing quote symbol ".
