NSCI0007 Coursework
Contents
NSCI0007 Coursework#
Introduction#
You will produce a Python notebook which simulates the movement of organisms around a neighbourhood. In Part 1 (35 marks) you will build the model, and in Part 2 (15 marks) you will investigate the behaviour of the model for various values of its parameters.
Submission#
You have been provided a new Cocalc project called [your name] - NSCI0007 COURSEWORK 22/23 which contains a folder COURSEWORK_FILES. The contents of this folder will be automatically collected at the end of the assessment period.
Attention
You MUST complete your work in the folder above. Work completed in any other location will not be marked.
Background#
Suppose there are two species of organism living in a neighbourhood. The organisms are initially spread about the neighbourhood at random, but are free to move around the neighbourhood as they wish. The organisms are lazy and so in general will stay where they are; however they have a slight preference for being surrounded by organisms of the same species. If too many of their immediate neighbours are of the opposite species, they will move to another location in the neighbourhood. Over time, the distribution of organisms will shift (Fig. 1).

Fig. 1 Organisms of two species (blue and green) are initially spread around the neighbourhood at random, with some cells empty (white). At each time step, dissatisfied organisms move into unoccupied cells, resulting in shifting patterns of organism locations.#
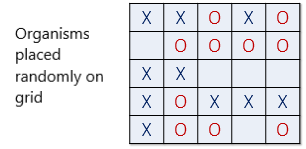
The neighbourhood consists of a square grid of cells, each of which is either empty or occupied by an organism of one of the two species. Populations of the two species are initially placed into random locations of a neighbourhood represented by a grid (Fig. 2).

Fig. 2 Organisms of two species (X and O) are placed at random in a 5 by 5 grid.#
The organisms prefer to be surrounded by organisms of the same type. An organism is satisfied if it is surrounded by at least a fraction \(f\) of organisms that are of a like species.
Let’s assume that \(f = 0.3\), meaning that an organism is satisfied when at least 30% of its neighbours are the same species as itself. If the organism is satisfied, then it will remain in its current location. If fewer than 30% are the same species, then the organism is not satisfied, and it will want to change its location in the grid.
Fig. 3 (left) shows a satisfied organism because 50% of X’s neighbors are also X \((50\% > f)\). The next X (right) is dissatisfied because only 25% of its neighbours are X \((25\% < f)\). Notice that empty cells are not counted when calculating similarity.

Fig. 3 An organism is satisifed if the proportion of its neighbours which are of the same species is greater than \(f\), otherwise it is dissatisfied. Given \(f=0.3\), the organism indicated in the left panel is satisfied because 50% of its neighbours are X, whereas the organism indicated in the right panel is dissatisfied because only 25% of its neighbours are X.#
When an organism is not satisfied, it is moved to a an empty cell in the grid. The new location is chosen at random from amongst the empty cells.
In Fig. 4 (left), all dissatisfied organisms have an asterisk next to them. Fig. 4 (right) shows the new configuration after all the dissatisfied organisms have been moved to unoccupied cells at random. Note that the new configuration may cause some organisms which were previously satisfied to become dissatisfied.

Fig. 4 In the left panel, all dissatisfied organisms have an asterisk next to them. In the right panel, all the dissatisfied organisms have been moved to unoccupied cells at random.#
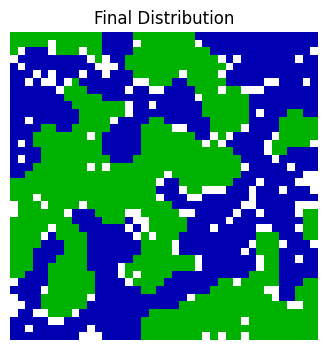
All dissatisfied organisms are moved in the same round. After the round is complete, a new round begins, and dissatisfied organisms are once again moved to new locations in the grid. These rounds continue until all organisms in the neighbourhood are satisfied with their location (Fig. 5).

Fig. 5 For certain values of \(f\), the distribution settles down to a stable pattern with the species segregated into distinct regions.#
Instructions#
Your goal is to simulate the evolution of the distribution of organisms for various values of the parameter \(f\). Your solution should be presented as a single Python notebook including working code and explanatory text.
Your notebook should:
run without errors
complete execution in no more than 1 minute
be well-organised with import statements, functions and executable code clearly separated
not include any redundant code
include sufficient text and/or comments such that a reader could easily understand the flow of your program
A maximum of 5 marks will be awarded to submissions that meet these requirements.
Part 1#
You will model the grid as an array containing the values 1 and 2 which represent the two species of organism and 0 which represents an empty cell.
Step 1#
Write a function initialise_grid(N, n) which returns an N by N array containing n 1s and n 2s placed at random cells in the array. Be sure that the returned array contains exactly the right number of 1s and 2s.
One (rather inefficient) way to do this is shown in following pseudocode, which creates an N by N array with exactly n 1s.
Set x to empty N by N array
Set counter to zero
Repeat until counter equals n:
Set i to random integer between 0 and N - 1
Set j to random integer between 0 and N - 1
If the value of x at i, j is 0:
set the value of x at i, j to 1
increase counter by 1
You can use the numpy function randint to generate a random integer in a given range.
Test that your code works as below (your function will not return this exact output, but it should return a 4 by 4 array with exactly the right number of 1s and 2s.)
grid = initialise_grid(4, 5)

# A 4 by 4 array with exactly 5 `1`s and 5 `2`s
print(grid)
[[0. 2. 1. 1.]
 [2. 0. 1. 2.]
 [0. 1. 2. 2.]
 [0. 1. 0. 0.]]
4 marks will be awarded for a function which correctly returns an array as described and 1 mark for including the test case.
Step 2#
Write a function neighbours_same(x, i, j) which returns the number of neighbours that are of the same species as cell i, j. Be careful that your function doesn’t go beyond the borders of the grid!
Test that your function works correctly in the following cases.
x_test = np.array([[2, 2, 1, 2, 1],
                   [0, 1, 1, 1, 1],
                   [2, 2, 0, 0, 0],
                   [2, 1, 2, 2, 2],
                   [2, 1, 1, 0, 1]])

print(neighbours_same(x_test, 0, 0))
print(neighbours_same(x_test, 0, 1))
print(neighbours_same(x_test, 1, 0))
print(neighbours_same(x_test, 1, 1))
1
1
0
2
4 marks for a function which returns the correct value for all possible arguments
x,iandj, and 1 mark for including the test cases.
Step 3#
Write a function neighbours_total(x, i, j) which returns the total number of non-empty neighbouring cells of cell i, j. Check that your function works in the following cases.
print(neighbours_total(x_test, 0, 0))
print(neighbours_total(x_test, 0, 1))
print(neighbours_total(x_test, 1, 0))
print(neighbours_total(x_test, 1, 1))
2
4
5
6
2 marks for a function which returns the correct value for all possible arguments
x,iandj, and 1 mark for including the test cases.
Step 4#
Write a function get_dissatisfied_cells(x, f) which returns an N by N array whose values are 1 for cells containing a dissatisfied organism, or 0 otherwise. An organism is dissatisfied if the fraction of its neighbours which are the same as it is less than f. Use should use your functions neighbours_same and neighbours_total to calculate the fraction of like neighbours.
Test that your function works for the array x_test.
f = 0.4

print(get_dissatisfied_cells(x_test, f))
[[0. 1. 0. 1. 0.]
 [0. 1. 0. 0. 0.]
 [0. 0. 0. 0. 0.]
 [0. 1. 0. 0. 0.]
 [1. 0. 0. 0. 1.]]
4 marks for a function which executes correctly for all possible arguments
xandf, and 1 mark for including the test case.
Step 5#
Write a function advance(x, f) which returns the array of cells after moving all dissatisfied organisms to an unoccupied cell.
You will need to do this in two steps:
Satisfied organisms stay where they are: create an empty array
result. Loop over all cells, and for each satisfied cell set the value ofresultto the same value as the equivalent cell inx.Dissatisfied organisms move to a random empty cell: loop over all cells again. For each dissatisfied cell, choose a random empty cell in
resultand set its value to the species number.
Check your code works as below (you won’t get exactly the same result of course).
f = 0.3

x2 = advance(x_test, f)
print(x2)
[[2. 1. 1. 0. 1.]
 [0. 1. 1. 1. 1.]
 [2. 2. 0. 1. 2.]
 [2. 0. 2. 2. 2.]
 [2. 1. 1. 2. 0.]]
6 marks for a function which works as described for all possible imputs of
xandf, 1 mark for including the test case.
Step 6#
Initialise a grid an 20 by 20 array with 45% of cells occupied by species 1, 45% occupied by species 2 and 10% unoccupied. Run the simulation for 10 iterations with f = 0.4. Display the contents of the array at each step using the function matplotlib.pyplot.imshow.
2 marks for correctly initialising the grid, 3 marks for executing the simulation and displaying the results.
Part 2#
In some cases the simulation reaches a stable pattern, whereas in others the distribution keeps changing indefinitely.
For what values of \(f\) does the grid eventually reaching a stable pattern? Investigate how the behaviour of the model depends on the value this parameter. Does it also depend on the size of the grid and the initial distribution of organisms?
Express your answer using code, figures and text. Take care with the presentation of your answer, including professionally formatted figures and explanations written in paragraph form. Use markdown cells to format your text.
A maximum of 15 marks for an investigation that fully explores the question.
Total: 50 marks

