Practice 3
Question 1
import matplotlib.pyplot as plt

pop = 100
r = 1.1
n = 10

pop_list = [pop]

for i in range(100):
    if i % 5 == 0:
        pop = pop - 31.7
    else:
        pop = pop * r
        pop_list.append(pop)

print(pop_list)

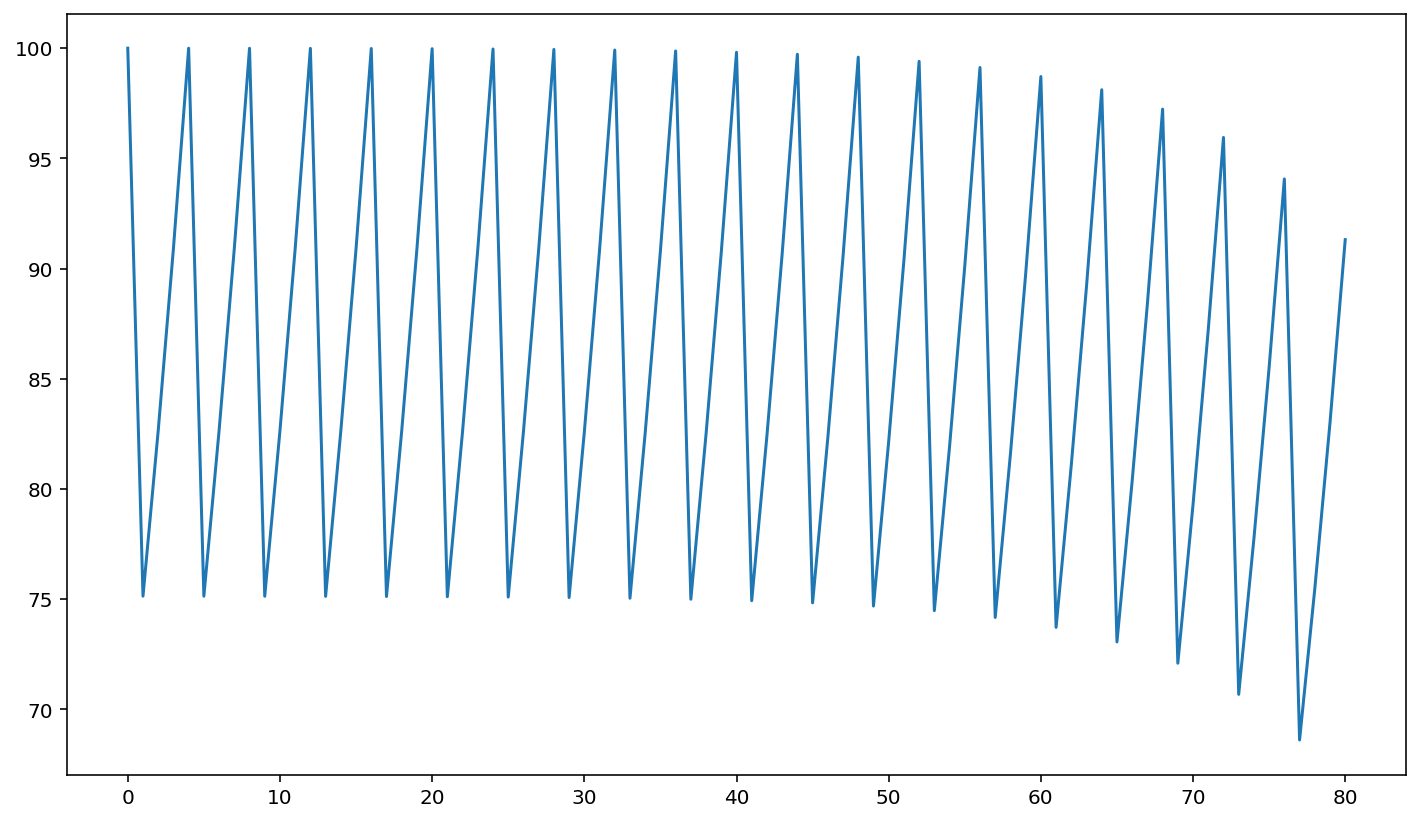
plt.plot(pop_list)
[100, 75.13000000000001, 82.64300000000001, 90.90730000000002, 99.99803000000003, 75.12783300000004, 82.64061630000005, 90.90467793000006, 99.99514572300008, 75.12466029530009, 82.6371263248301, 90.90083895731313, 99.99092285304445, 75.1200151383489, 82.63201665218381, 90.8952183174022, 99.98474014914243, 75.11321416405667, 82.62453558046235, 90.8869891385086, 99.97568805235946, 75.10325685759541, 82.61358254335497, 90.87494079769047, 99.96243487745953, 75.08867836520548, 82.59754620172603, 90.85730082189865, 99.94303090408852, 75.06733399449737, 82.57406739394712, 90.83147413334184, 99.91462154667603, 75.03608370134364, 82.53969207147802, 90.79366127862582, 99.8730274064884, 74.99033014713724, 82.48936316185097, 90.73829947803608, 99.8121294258397, 74.92334236842368, 82.41567660526604, 90.65724426579266, 99.72296869237194, 74.82526556160913, 82.30779211777005, 90.53857132954707, 99.59242846250179, 74.68167130875197, 82.14983843962717, 90.3648222835899, 99.4013045119489, 74.47143496314379, 81.91857845945817, 90.110436305404, 99.12147993594441, 74.16362792953885, 81.57999072249274, 89.73798979474202, 98.71178877421623, 73.71296765163785, 81.08426441680164, 89.19269085848181, 98.11195994433, 73.053155938763, 80.3584715326393, 88.39431868590324, 97.23375055449358, 72.08712560994294, 79.29583817093724, 87.22542198803097, 95.94796418683408, 70.6727606055175, 77.74003666606926, 85.51404033267619, 94.06544436594382, 68.6019888025382, 75.46218768279203, 83.00840645107124, 91.30924709617837]
[<matplotlib.lines.Line2D at 0x7fd8a89ed880>]

Question 2
# 1

x1 = []

for i in range(5, 17, 2):
    x1.append(i)

print(x1)

# 2

x2 = []

for i in range(6):
    x2.append(10**i)

print(x2)

# 3

x3 = []

for i in range(9):
    x3.append(i % 3)

print(x3)
[5, 7, 9, 11, 13, 15]
[1, 10, 100, 1000, 10000, 100000]
[0, 1, 2, 0, 1, 2, 0, 1, 2]
Question 3
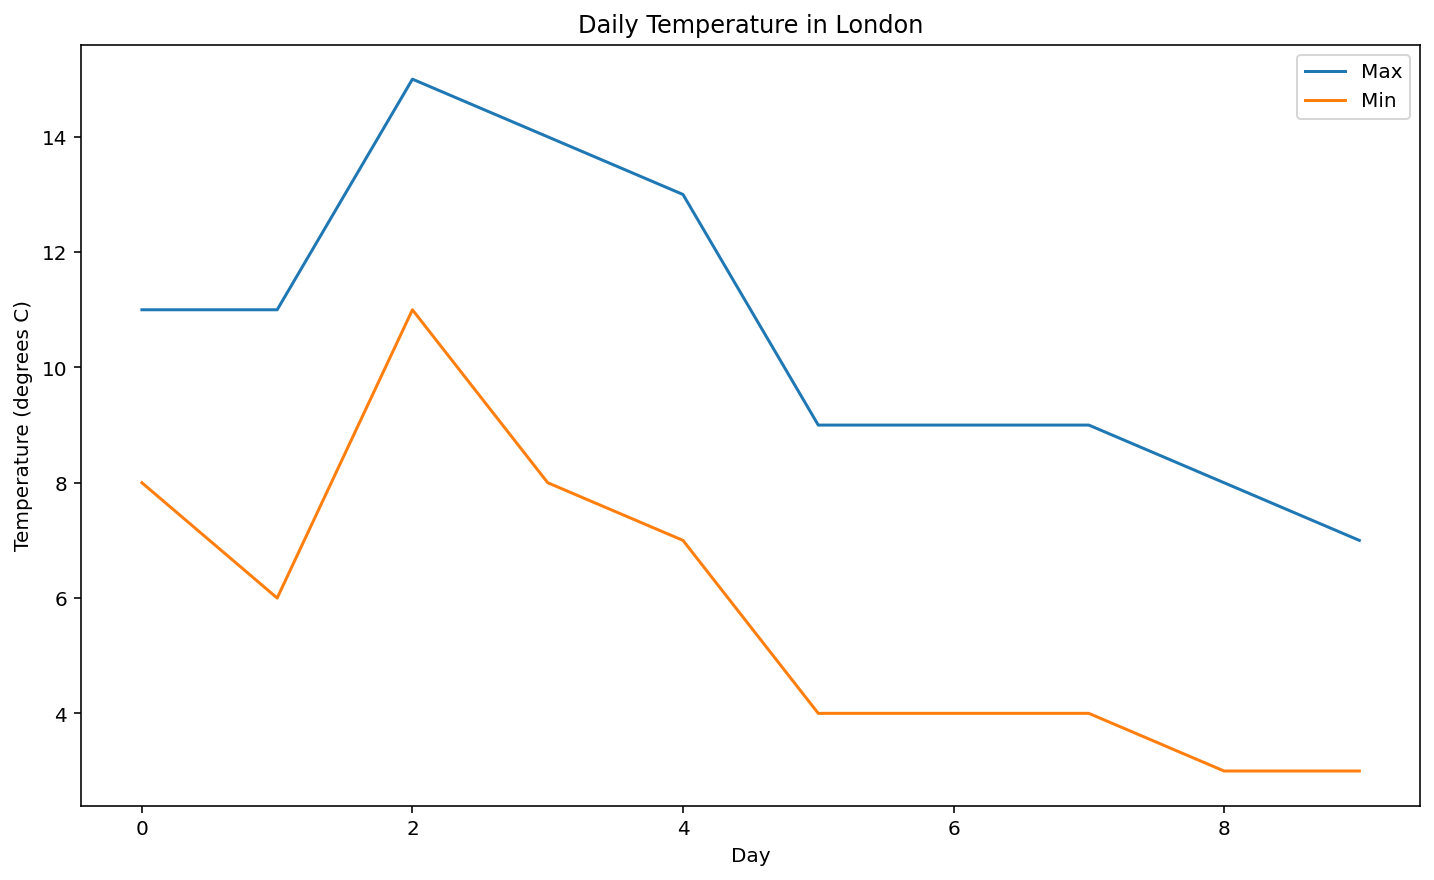
temp_max = [11, 11, 15, 14, 13, 9, 9, 9, 8, 7]
temp_min = [8, 6, 11, 8, 7, 4, 4, 4, 3, 3]

plt.plot(temp_max, label="Max")
plt.plot(temp_min, label = "Min")
plt.xlabel("Day")
plt.ylabel("Temperature (degrees C)")
plt.legend()
plt.title("Daily Temperature in London")
Text(0.5, 1.0, 'Daily Temperature in London')

Question 4
NB There are many ways to answer this question. The following only uses techniques described in the notes.
x = [18, 19, 10, 19, 11, 7, 12, 6, 5, 4]
n = len(x)
x1 = []
for i in range(0, n, 2):
    x1.append(x[i])

print(x1)

x2 = []
for z in x:
    if z % 2 == 0:
        x2.append(z)
print(x2)

x3 = []
for i in range(n):
    x3.append(x[n-i-1])
print(x3)

x4 = [x[0], x[n-1]]
print(x4)
[18, 10, 11, 12, 5]
[18, 10, 12, 6, 4]
[4, 5, 6, 12, 7, 11, 19, 10, 19, 18]
[18, 4]
