Tutorial 3
Question 1
#1

import matplotlib.pyplot as plt

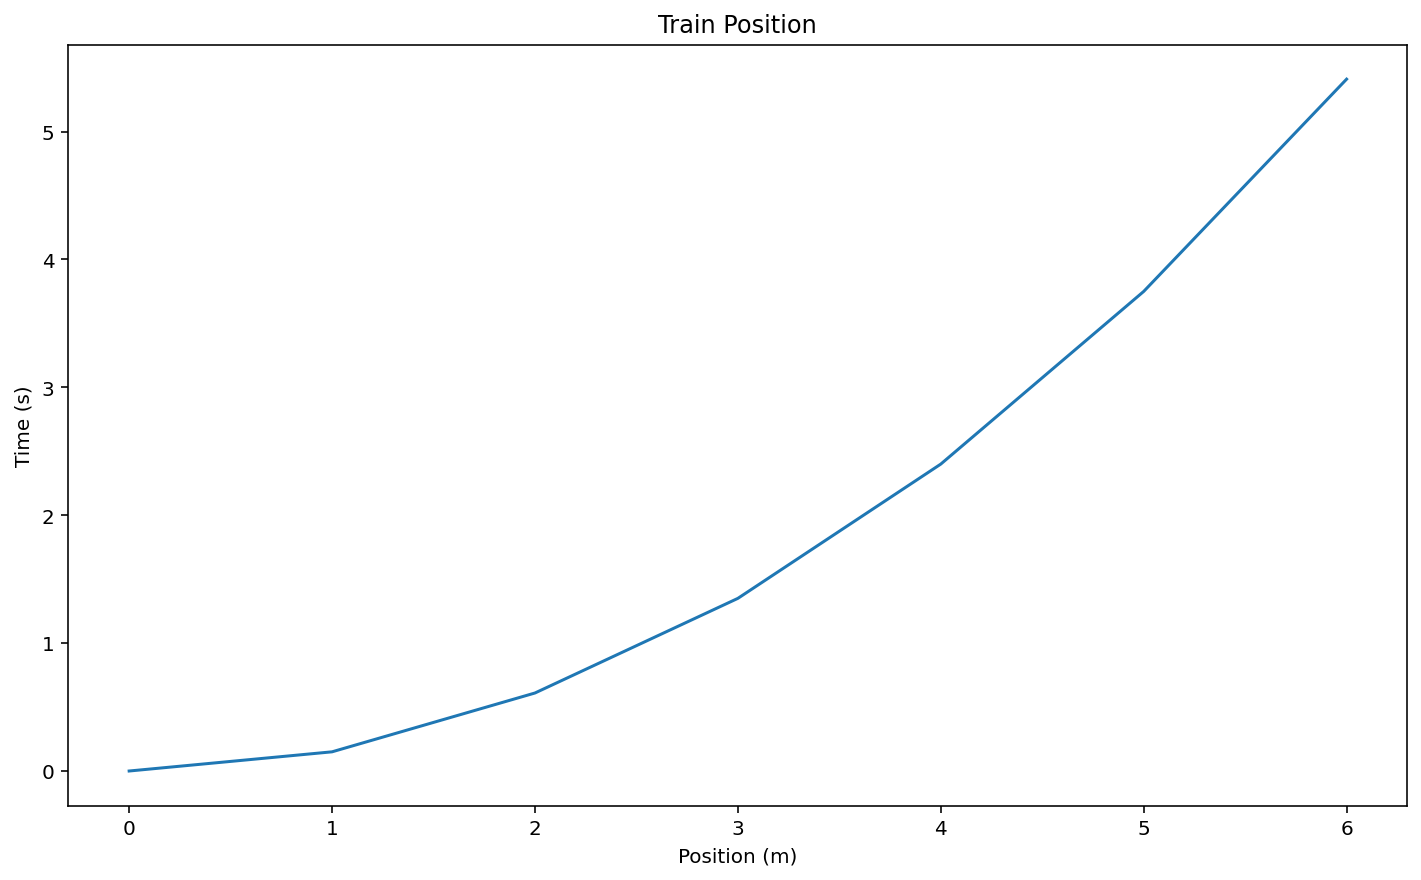
time = [0, 1, 2, 3, 4, 5, 6]
position = [0, 0.15, 0.61, 1.35, 2.40, 3.75, 5.41]

plt.plot(time, position)

plt.title("Train Position")
plt.ylabel("Time (s)")
plt.xlabel("Position (m)")
Text(0.5, 0, 'Position (m)')
#2,3

pos_est = []
#a = 0.2
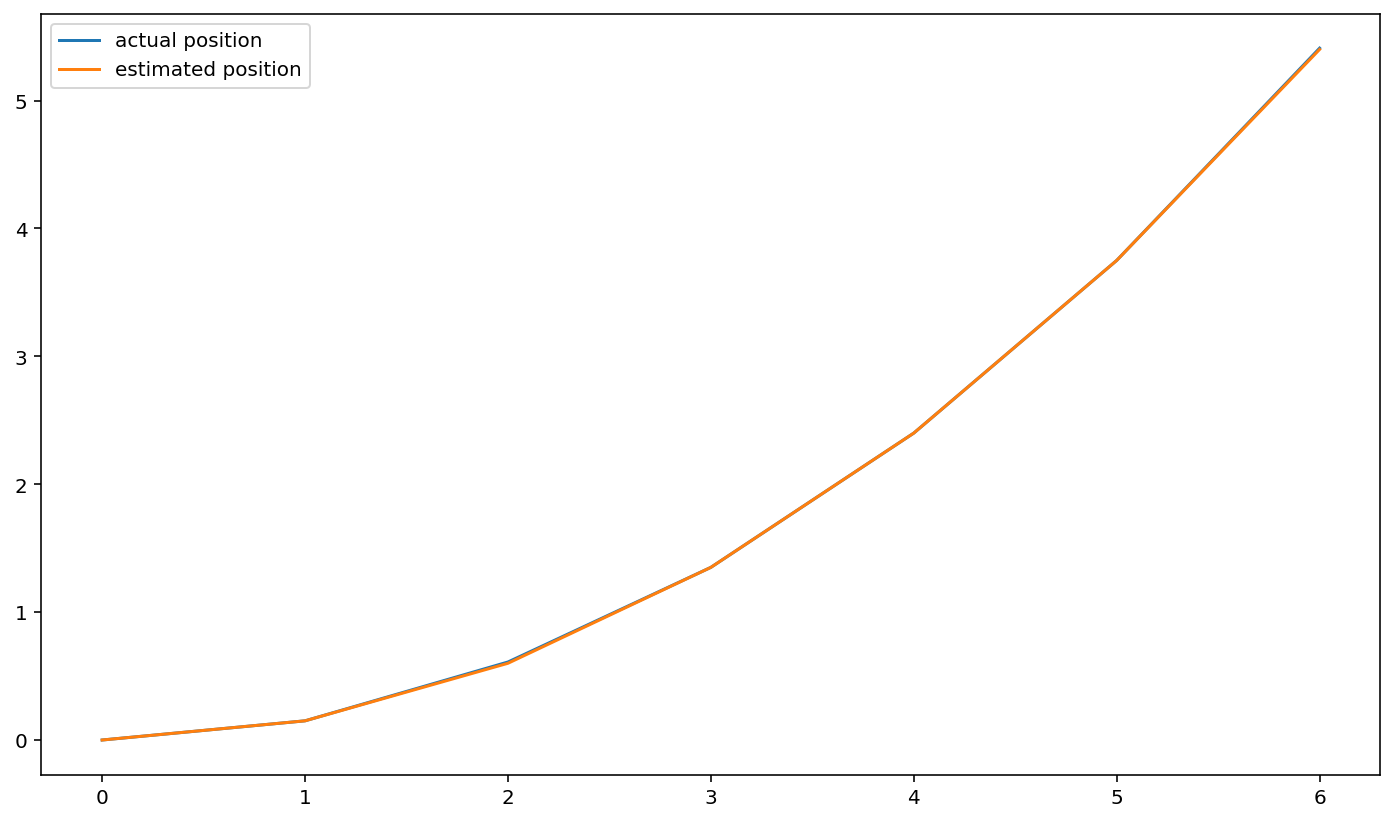
#change value of a until the two lines match
a = 0.3
for t in time:
    s = 0.5 * a * t**2
    pos_est.append(s)

plt.plot(time, position, label="actual position")
plt.plot(time, pos_est, label="estimated position")
plt.legend()

# acceleration is 0.3 m/s^2
<matplotlib.legend.Legend at 0x7f56f1266d60>
Question 2
import matplotlib.pyplot as plt

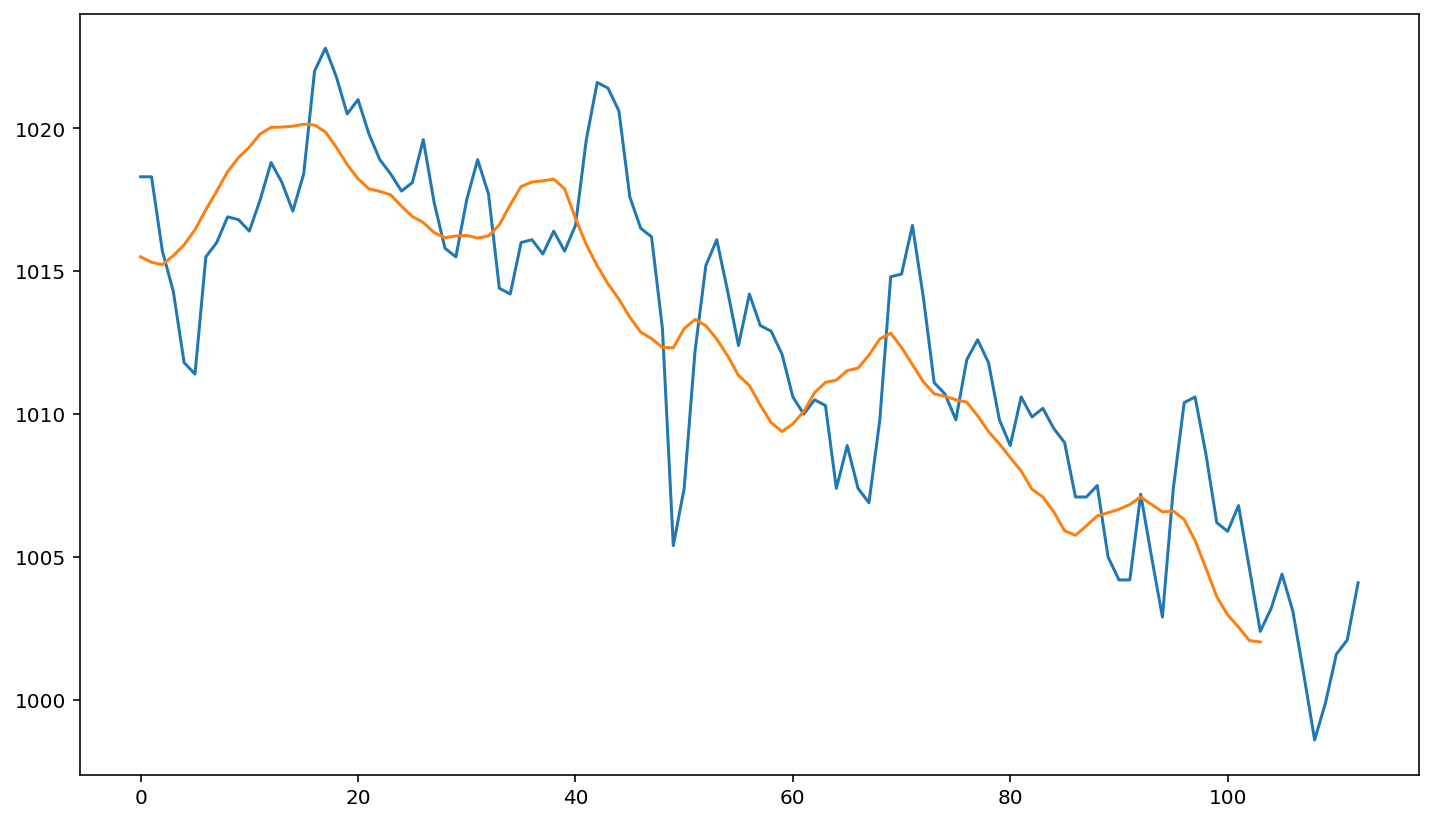
pressure_data = [1018.3, 1018.3, 1015.7, 1014.3, 1011.8, 1011.4, 1015.5, 1016.0, 1016.9, 1016.8, 1016.4, 1017.5, 1018.8, 1018.1, 1017.1, 1018.4, 1022.0, 1022.8, 1021.8, 1020.5, 1021.0, 1019.8, 1018.9, 1018.4, 1017.8, 1018.1, 1019.6, 1017.4, 1015.8, 1015.5, 1017.5, 1018.9, 1017.7, 1014.4, 1014.2, 1016.0, 1016.1, 1015.6, 1016.4, 1015.7, 1016.6, 1019.6, 1021.6, 1021.4, 1020.6, 1017.6, 1016.5, 1016.2, 1013.0, 1005.4, 1007.4, 1012.2, 1015.2, 1016.1, 1014.3, 1012.4, 1014.2, 1013.1, 1012.9, 1012.1, 1010.6, 1010.0, 1010.5, 1010.3, 1007.4, 1008.9, 1007.4, 1006.9, 1009.8, 1014.8, 1014.9, 1016.6, 1014.1, 1011.1, 1010.7, 1009.8, 1011.9, 1012.6, 1011.8, 1009.8, 1008.9, 1010.6, 1009.9, 1010.2, 1009.5, 1009.0, 1007.1, 1007.1, 1007.5, 1005.0, 1004.2, 1004.2, 1007.2, 1005.0, 1002.9, 1007.4, 1010.4, 1010.6, 1008.6, 1006.2, 1005.9, 1006.8, 1004.6, 1002.4, 1003.2, 1004.4, 1003.1, 1000.9, 998.6, 999.9, 1001.6, 1002.1, 1004.1]


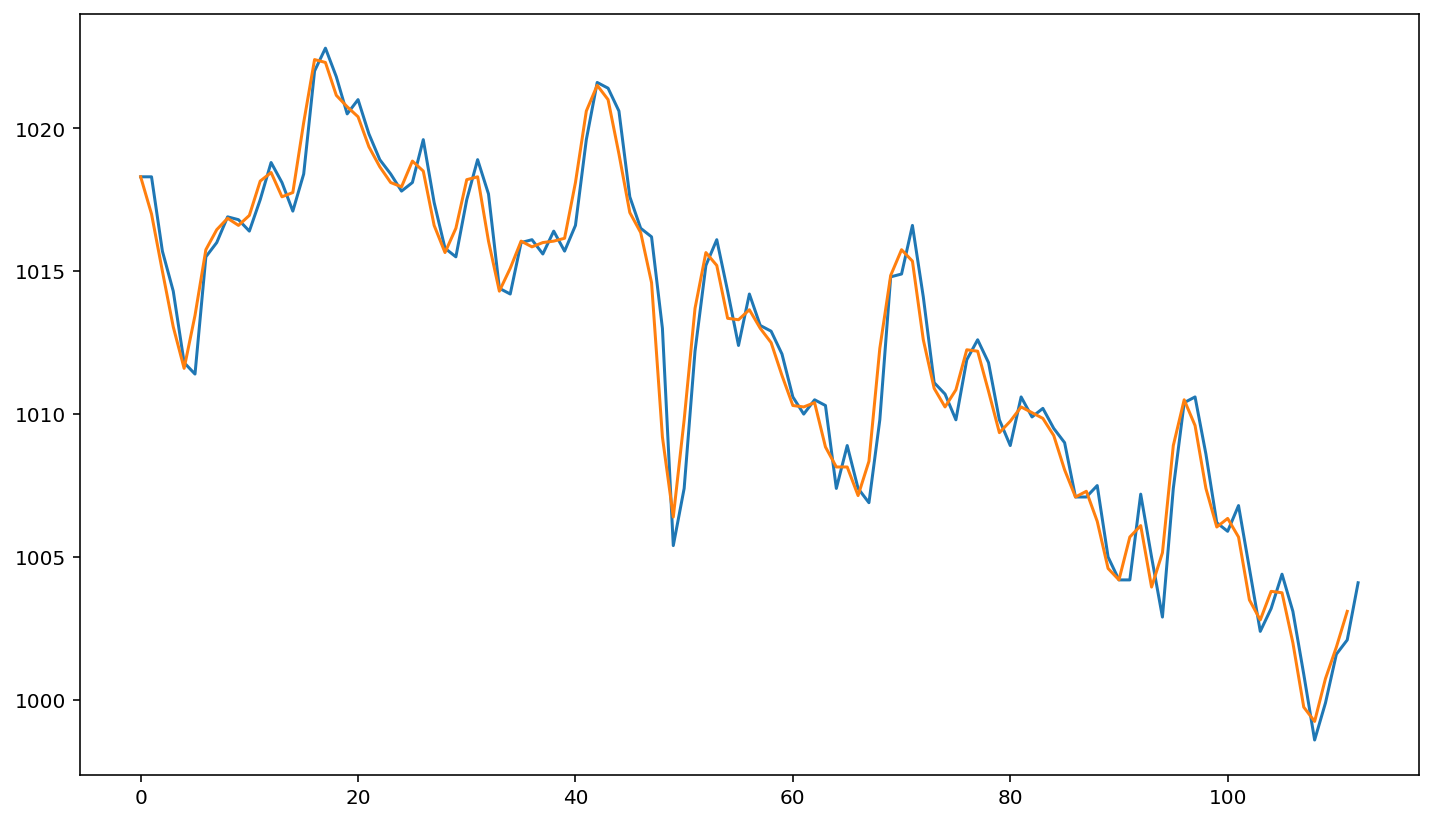
pressure_smoothed = []
for i in range(len(pressure_data)-1):
    pressure_smoothed.append(0.5*(pressure_data[i] + pressure_data[i+1]))

plt.plot(pressure_data)
plt.plot(pressure_smoothed)
[<matplotlib.lines.Line2D at 0x7f56f11fbdc0>]
Challenge
Later we will see an easier way to do this using numpy arrays.
pressure_smoothed = []
n = 10
for i in range(len(pressure_data)-n+1):
    #calculate average of n points
    avg = 0
    for j in range(i, i+n):
        avg = avg + pressure_data[j]
    avg = avg / n
    pressure_smoothed.append(avg)

plt.plot(pressure_data)
plt.plot(pressure_smoothed)
[<matplotlib.lines.Line2D at 0x7f56f1169970>]
Question 3
dna_seq = "gttccccaagctcttacataaatgtcgtagggttccagctacgtgttgttgggccaccca"

letters = ["a", "g", "c", "t"]
names = ["Adenine", "Guanine", "Cytosine", "Thymine"]

for c in dna_seq:
    i = letters.index(c)
    name = names[i]
    print(name, end=", ")
Guanine, Thymine, Thymine, Cytosine, Cytosine, Cytosine, Cytosine, Adenine, Adenine, Guanine, Cytosine, Thymine, Cytosine, Thymine, Thymine, Adenine, Cytosine, Adenine, Thymine, Adenine, Adenine, Adenine, Thymine, Guanine, Thymine, Cytosine, Guanine, Thymine, Adenine, Guanine, Guanine, Guanine, Thymine, Thymine, Cytosine, Cytosine, Adenine, Guanine, Cytosine, Thymine, Adenine, Cytosine, Guanine, Thymine, Guanine, Thymine, Thymine, Guanine, Thymine, Thymine, Guanine, Guanine, Guanine, Cytosine, Cytosine, Adenine, Cytosine, Cytosine, Cytosine, Adenine,
Question 4
import numpy as np
import matplotlib.pyplot as plt

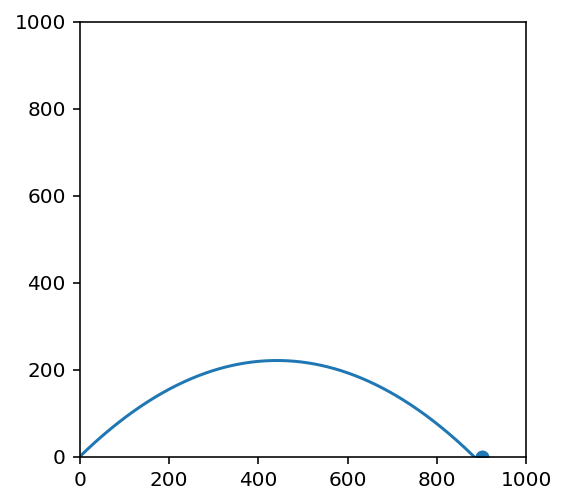
s = 93 # launch speed 93 m/s
theta = np.pi/4 # pi/4 radians equals 45 degrees

DELTA_T = 0.01
g = 9.8

x = 0 # initial x, y positions
y = 0
vx = s * np.cos(theta) # initial x, y velocities
vy = s * np.sin(theta)

dis = 900

x_list = []
y_list = []

while y >= 0:
    x_list.append(x)
    y_list.append(y)
    x = x + vx * DELTA_T
    y = y + vy * DELTA_T

    vy = vy - g * DELTA_T

plt.figure(figsize=(4,4))
plt.plot(x_list, y_list)
plt.xlim(0, 1000)
plt.ylim(0, 1000)
plt.scatter(dis, 0) # plot the location of the target

if x > dis - 20 and x < dis + 20:
    print("hit")
else:
    print("miss")
hit
