Practice 5
Question 1
import numpy as np
x = np.array([[10, 12, 13],
              [5, 6, 7]])
row_1 = x[0,:]
print("First row:", row_1)

column_2 = x[:,2]
print("last column:", column_2)


sum_column = x[:,0] + x[:,1]  + x[:,2]
print("sum of columns:", sum_column)

sum_row = x[0,:] + x[1,:]
print("sum of rows:", sum_row)
First row: [10 12 13]
last column: [13  7]
sum of columns: [35 18]
sum of rows: [15 18 20]
Question 2
import numpy as np
import matplotlib.pyplot as plt

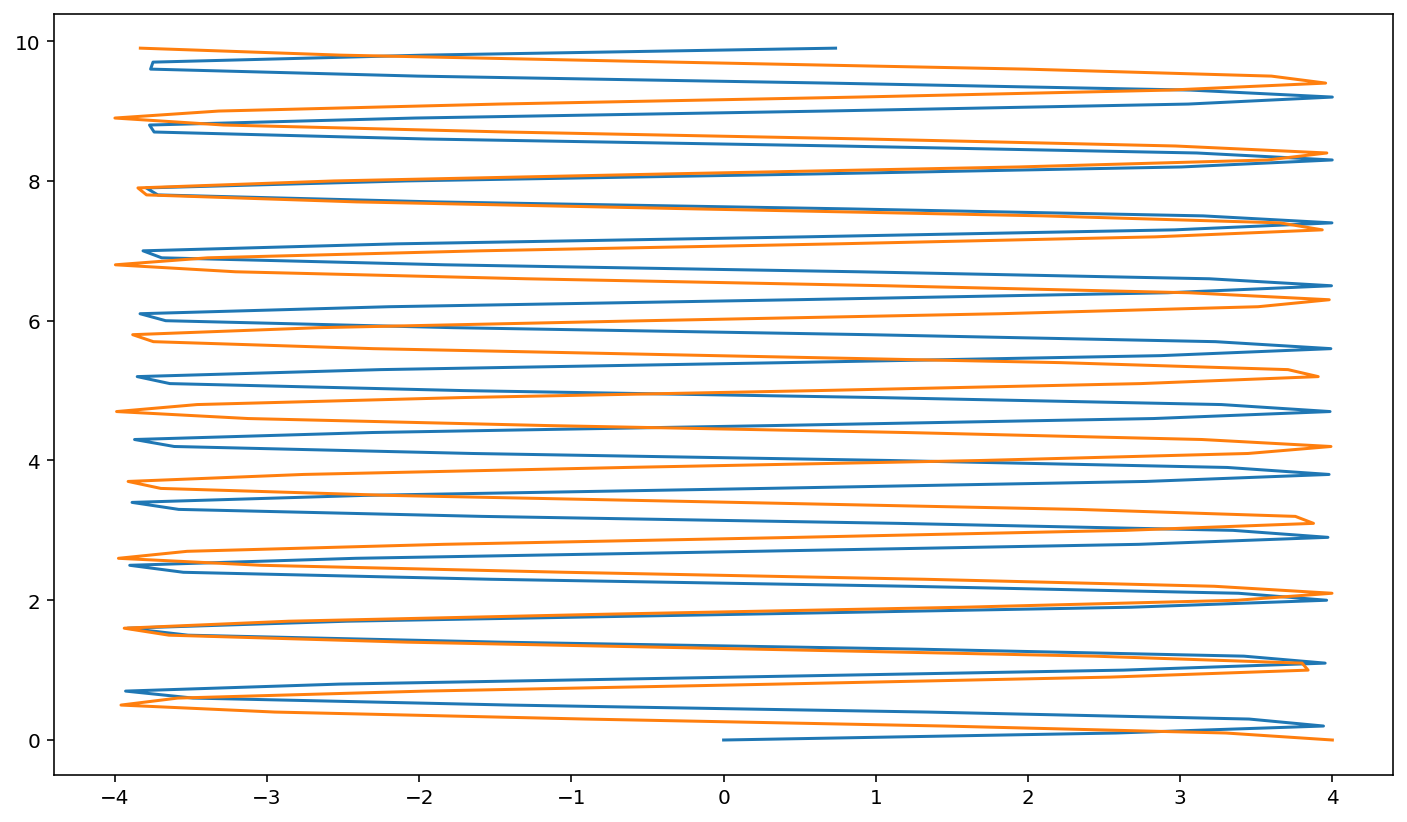
t = np.arange(0, 10, 0.1)

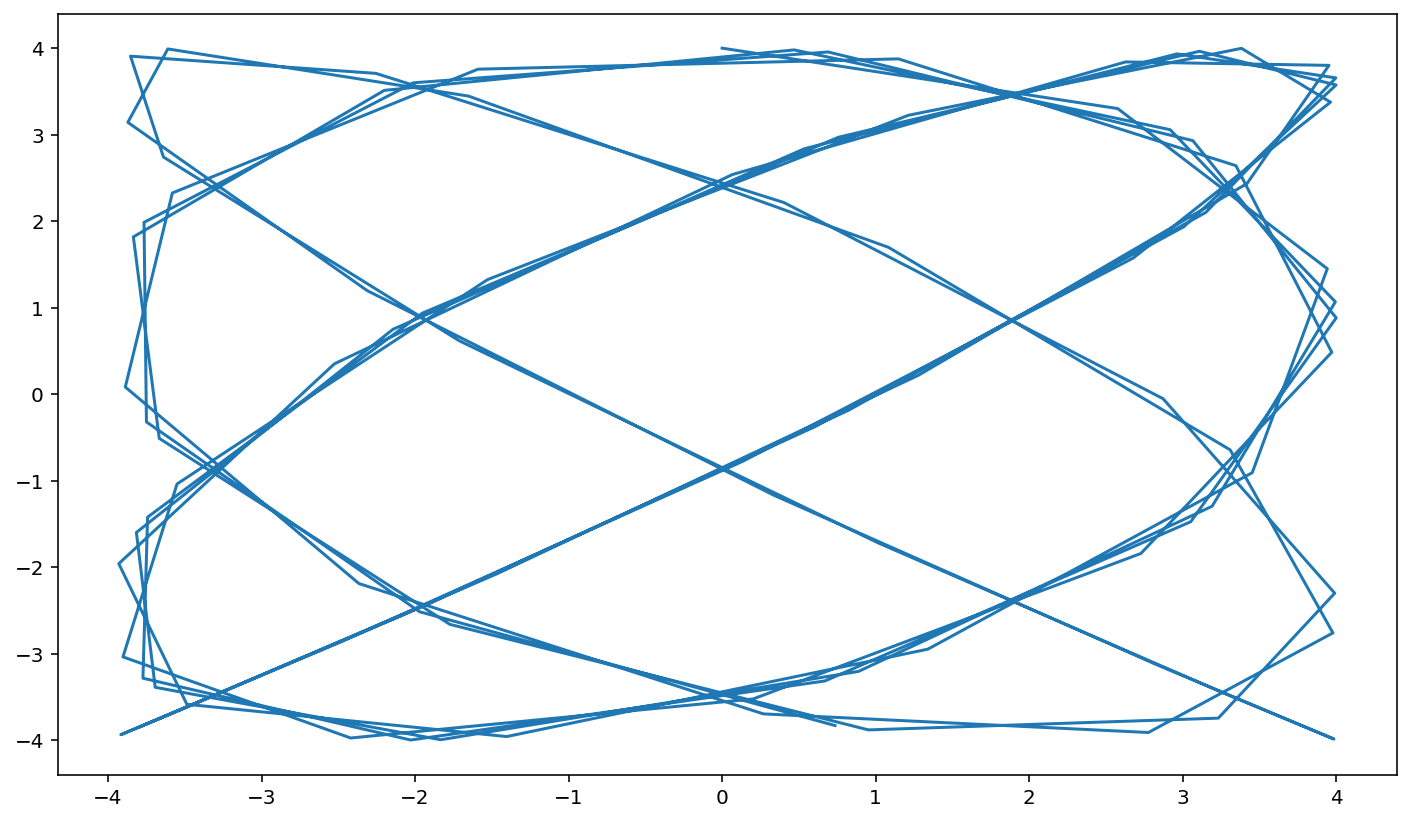
x = 4 * np.sin(7*t)
y = 4 * np.cos(6*t)

plt.figure()
plt.plot(x, t)
plt.plot(y,t)

plt.figure()
plt.plot(x,y)
[<matplotlib.lines.Line2D at 0x7fe6213bba30>]


Question 3
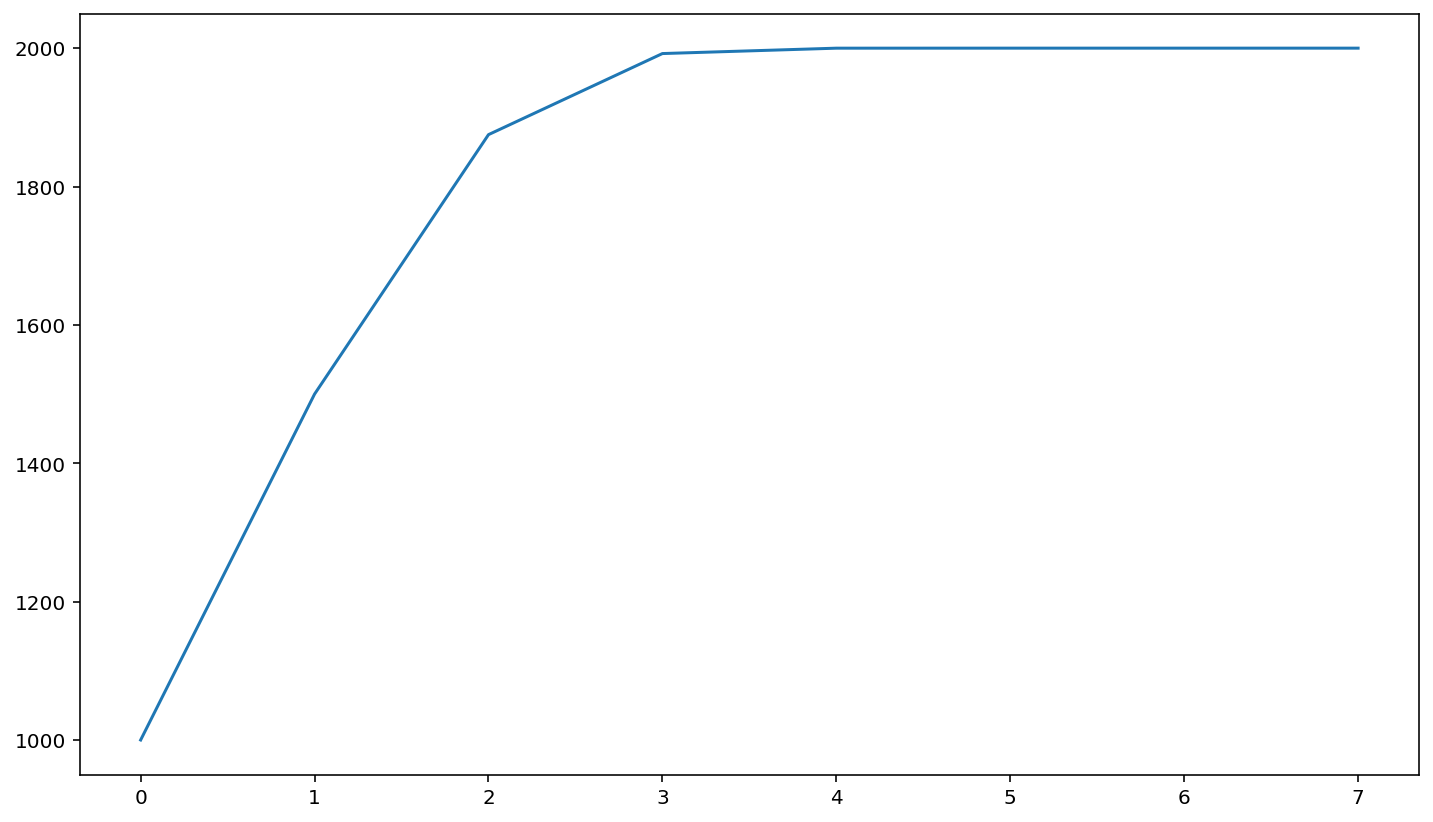
\(r\) is the initial growth rate. \(K\) is the ‘carrying capacity’ ie the maximum population.
import numpy as np
import matplotlib.pyplot as plt

# set parameter values
r = 1
K = 2000
n_hours = 8
initial_population = 1000

# create array of time points
t = np.arange(0, n_hours, 1)

pop = np.zeros(n_hours)
pop[0] = initial_population

# run simulation
for i in range(n_hours - 1):
    pop[i+1] = pop[i] + r * (1 - pop[i] / K) * pop[i]

plt.plot(t, pop)
[<matplotlib.lines.Line2D at 0x7fe6211c4fd0>]

