Solutions#
Solution to Exercise 3.14
One possible solution is shown below, but please read further for a critique of the solution!
import numpy as np
import matplotlib.pyplot as plt

def is_divisible(n, m):
    return n % m == 0

def is_prime(n):
    result = True
    for i in range(2, n):
        if is_divisible(n, i):
            result = False
    return result

def number_of_primes(n):
    result = 0
    for i in range(2, n+1):
        if is_prime(i):
            result += 1
    return result

n_max = 50
total_primes = np.zeros(n_max)
for i in range(2, n_max):
    total_primes[i] = number_of_primes(i)

print(total_primes)
[ 0.  0.  1.  2.  2.  3.  3.  4.  4.  4.  4.  5.  5.  6.  6.  6.  6.  7.
  7.  8.  8.  8.  8.  9.  9.  9.  9.  9.  9. 10. 10. 11. 11. 11. 11. 11.
 11. 12. 12. 12. 12. 13. 13. 14. 14. 14. 14. 15. 15. 15.]
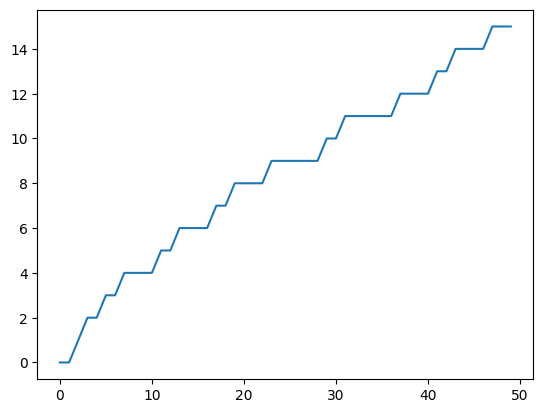
plt.plot(total_primes)
[<matplotlib.lines.Line2D at 0x257cb2c7cc8>]
Comments#
1. The function
is_divisibleis only one line. Perhaps it would better to integrate this code directly into thenumber_of_primesfunction, although I think including a separate function makes the code clear and easy to understand.2. Another way to write the
is_primefunction, making use of the fact that thereturnstatement causes the function to exit immediately (even in the middle of a loop):3. The function
is_primedoesn’t work correctly in the case thatn = 0orn = 1. This meant that I had to start my loop at 2for i in range(2, n_max):. Perhaps it would be neater to change theis_primefunction so that it returnsFalsein these cases, although it would probably have to treat0and1as special cases.4. The line
plt.plot(total_primes)only has one function argument, which means that the x values are automatically the index range of the arraytotal_primesi.e.0…n_max-1.5. A line graph isn’t the best choice here. We could instead plot individual points as below.
6. This code is very inefficient because we have to call
is_primerepeatedly for each number. You could avoid this inefficiency by refactoring the code and using the numpy functioncumsum.