Freshwater sustainability
Contents
12. Freshwater sustainability#
Mami Mitzuri, UN Special Representative for Disaster Risk Reduction
Drought could be next pandemic and there is no vaccine to cure it. Drought has directly affected 1.5 billion people this century. This number will grow dramatically unless we manage this risk, understand its root causes and take preventive action [Twitter]
This case study on freshwater sustainability is provided for you to practice solving mathematical problems in context and using your results to make informed conclusions or judgements.
The case study also includes a question on fitting straight lines to data points, which is an important background technique for the work that we will do on calculus.
12.1. Water Stress#
To use our freshwater resource sustainably, the rate at which we make withdrawals must be below the rate at which stocks are replenished (e.g. by rainfall). If we consume more than the amount restored by nature, the resulting decrease in water levels can cause damage to the environment.
When assessing water resources within countries we may distinguish between internal renewable water resource (IRWR) and external renewable water resource (ERWR). The latter consists of deposits into the country, which may come from natural flows such as rivers or from delivery by pipes or freight. Together, the IRWR and ERWR make up the total renewable water resource (TRWR). The other key measure that we are interested in is total freshwater withdrawals (TFWW).
Data for several countries are shown in Table 12.1. The rightmost column in the table is the Water Stress Index (WSI), which is United Nations Sustainable Development Goal (SDG) indicator 6.4.2. It is calculated by the equation
The environmental flow requirement (EFR) accounts for the downstream environmental impact of withdrawals, for example on aquatic life and biodiversity.
Country | IRWR (Gm3/yr) | ERWR (Gm3/yr) | TFWW (Gm3/yr) | Population (millions) | WSI % |
|---|---|---|---|---|---|
| Brazil | 5661.00 | 2986.00 | 64.61 | 209.46932 | 1.42 |
| China | 2812.90 | 27.32 | 591.80 | 1459.37761 | 43.22 |
| Egypt | 1.00 | 56.50 | 77.50 | 98.42360 | 141.17 |
| India | 1446.00 | 464.90 | 647.50 | 1352.64228 | 66.49 |
| Pakistan | 55.00 | 191.80 | 192.74 | 212.22829 | 118.24 |
| United Kingdom | 145.00 | 2.00 | 8.42 | 67.14168 | 14.35 |
| United States of America | 2818.00 | 251.00 | 444.40 | 327.09627 | 28.16 |
| World | 42808.60 | 11928.50 | 3955.78 | 7626.37978 | |
If you want to find data for another country you can look this up using the AQUASTAT database, provided by the Food and Agriculture Organization of the United Nations.
Click for more information
The following AQUASTAT database variables are shown in Table 12.1. The database provides an extremely rich source of information about freshwater availability and use, and of the impacts of water management on human health. You may wish to explore some of the other variables by yourself.
| Category | Subcategory | Variable |
|---|---|---|
| Geography and population | Population | Total population |
| Water resources | Internal renewable water resources | Total internal renewable water resources (IRWR) |
| External renewable water resources | Total external renewable water resources (ERWR) | |
| Water use | Water withdrawal by source | Total freshwater withdrawal |
| Pressure on water resources | SDG 6.4.2 Water Stress |
Exercise 12.1
For each country in Table 12.1, calculate the values listed below:
the per-capita values for TRWR and TFWW
the proportion of TRWR used, ignoring EFR
the dependency ratio (external fraction of TRWR)
Based on your results, write down some of your initial thoughts about world water usage and distribution. We will explore the relationships between water distribution and water usage further in the next sections.
Hint:
Per capita rates are calculated by dividing the relevant statistic by the country’s population. Dependency ratios are calculated by taking ERWR/TRWR.
The proportion used is given by TFWW/TRWR, which was used as Millennum Development Goal (MDG) indicator 7.5. This indicator is not as sophisticated as the WSI because it does not take account of the downstream impact of water withdrawals and therefore underestimates the level of water stress. The MDGs were succeeded by the SDGs in 2016.
Exercise 12.2
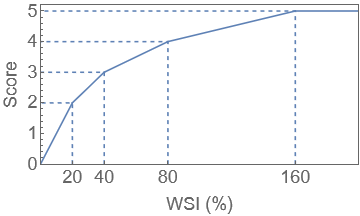
In some literature, the WSI is rescaled and categorised. An example of how this may be done is given in the table below, which follows the coding scheme of the WRI. Taking the relationship between WSI and Score to be linear within each category, as shown in the image, calculate the scores for each of UK, India and Pakistan.
Stress category |
Score |
WSI |
|---|---|---|
Low |
0-1 |
<10% |
Low to medium |
1-2 |
10-20% |
Medium to high |
2-3 |
20-40% |
High |
3-4 |
40-80% |
Extremely high |
4-5 |
>80% |
Hint:
The key property of a straight line is that the “rise over run” is constant. In coordinates \((x,y)\) we may write the following relationship, where \(\Delta y\) denotes the change in \(y\) and \(\Delta x\) denotes the change in \(x\) :
12.2. Water scarcity innovations:#
Singapore and Dubai are two of the world’s most water stressed places, due to a lack of renewable water resources. Singapore gets a significant portion of its TFWW from its neighbour Malaysia, but has also developed an advanced system to turn sewage into clean, drinkable water that can meet 40% of demand [VOA news]. In Dubai, around 90% of the city’s needs are supplied by desalinated seawater.
As global freshwater pressures intensify, such measures may become more common. The UK already has a desalination plant operated by Thames Water in Beckton, which can provide up to 150 million litres of drinking water each day. The Chief Executive of the UK Environment Agency has said that the UK will need more desalination plants [speech, Mar/2019] and that people need to be ‘less squeamish’ about drinking water taken from sewage treatment plants [BBC article, Aug/2022].
Such solutions must be looked at carefully. For instance, the process of desalination requires large amounts of energy and therefore may substitute one scarce resource (freshwater) for another (energy). Desalination also produces a toxic brine by-product, which can damage coastal and marine ecosystems if it is pumped back into the ocean.
12.3. Water footprint#
If we only look at water withdrawals this masks some important truths about the characteristics of water consumption. We may marvel that the UK’s water withdrawal per-capita is much lower than that of other countries. The source of these disparities lies in the “hidden water” that is used during the production of many of the items that we consume.
Water consumption by the UK is much higher than the TFWW, due to imports of food and manufactured products. In addition, when examining water usage it is helpful to consider not only water that is drawn from lakes, rivers and aquifiers (so-called “blue water”), but also water pollution and the use of water stored in soil. Finally, it is important to note that some of the water that we withdraw typically returns to rivers and aquifiers and can be re-used.
These considerations have led to the definition of a “water footprint” (WF), which is a measure of humanity’s appropriation of fresh water in volumes of water consumed and/or polluted [waterfootprint.org]
The WF is separated into green, blue and grey parts, which are defined in the table below. The percentage figures given in the table are estimates for the global average of all water-consuming activities.
Type | Description | Fraction of WF |
|---|---|---|
| Green | Rainwater (e.g. stored in soil) | 74% |
| Blue | Surface and groundwater | 11% |
| Grey | Water pollution impact | 15% |
The relationships between water withdrawals and the blue water footprint are estimated in the table below.
Type of supply | Fraction of TFWW | Consumed portion |
|---|---|---|
| Agricultural | 69% | ~35% |
| Industrial | 19% | ~5% |
| Municipal | 12% | ~10% |
Exercise 12.3
Use the value for the world TFWW given in Table 12.1, together with the information in Table 12.3 to estimate the world Blue Water Footprint (BFW). Convert your result to a per-capita daily figure in litres.
According to a paper published in 2021 , the UK annual BWF is approximately 8880 Mm3. Convert this to a per-capita value and comment whether the result is different to the global average.
Hint:
According to the given information, the world TFWW is around 3956 Gm3.
Of this figure,
The portion consumed by agriculture is around 35% of 69%
The portion consumed by industry is around 5% of 19%
The portion consumed by households is around 10% of 12%
Convert to a daily per-capita figure by dividing by the global population and the number of days in a year.
12.4. Your personal water footprint#
According to the water footprint network, the average person in the UK has a “water footprint” of around 3400 litres per day. This figure is consistent with the values presented in the last section. You can use the virtual explorer on their website to see how it compares to the per-capita water footprint of other countries.
Having noted that domestic water use is a relatively small fraction of the overall freshwater budget, most people are still suprised to find out how much water they consume through day-to-day activties such as washing and flushing the toilet. Check your water statement if you get one! At home, the average UK person uses around 150 litres of water per day.
A major additional contribution to your water footprint comes from the foods that you consume. Examples of indicative water footprints for some common food items can be found on the waterfootprint product gallery.
However, every item that you consume has a water footprint. For example, in 2016 WRAP estimated that the water footprint of clothes used in the UK was 8 trillion litres, a figure that is quoted in the House of Commons Environmental Audit Committee report on “Fixing Fashion”. About one fifth of the global water footprint due to cotton consumption is related to pollution. Indicative values for the water footprints of a pair of jeans and t-shirt are given in the table below. It has also been estimated that the combined blue and green footprint of a single sheet of A4 paper is around 2-13 litres.
Product |
Blue WF |
Green WF |
Grey WF |
|---|---|---|---|
Jeans |
4900 |
4450 |
1500 |
T-shirt |
4400 |
4000 |
1350 |
Further reading about water
UNESCO 2021 report: valuing water | See foreword by Audrey Azoulay, Director-General of UNESCO.
UN Progress report 2021 | Read the executive summary and download the infographic.
UK Water Footprint, WWF | includes case studies