Freshwater solutions
Contents
Freshwater solutions#
Exercise 12.1#
Country | TRWR litres/person/day | Dependency % | TFWW litres/person/day | TFWW/TRWR % |
|---|---|---|---|---|
| Brazil | 113097.00 | 34.53 | 845.06 | 0.75 |
| China | 5332.02 | 0.96 | 1111.00 | 20.84 |
| Egypt | 1600.57 | 98.26 | 2157.30 | 134.78 |
| India | 3870.46 | 24.33 | 1311.49 | 33.88 |
| Pakistan | 3186.02 | 77.71 | 2488.15 | 78.10 |
| United Kingdom | 5998.36 | 1.36 | 345.58 | 5.73 |
| United States of America | 25705.60 | 8.18 | 3722.25 | 14.48 |
| World | 19663.90 | N/A | 1421.09 | 7.23 |
Some observations:
When measured in this way, the USA is the largest user of freshwater, withdrawing 3700 litres of water per resident every day. It may seem striking that the USA uses ten times as much water per resident as the UK. Can you think why this might be? The United States Geological Survey’s (USGS) Water Science School may provide some further insight.
Egypt has a very high water dependency ratio, depending on external resources for more than 98% of its total renewable water resource. It is also highly water stressed, with water use exceeding the total renewable supply by 50 billion litres each day (500 litres per capita).
Brazil’s apparent water wealth masks huge national disparities. A combination of geographic and enviromental factors, enormous levels of agricultural exports and decades of water mismanagement have resulted in a water crisis. Europe is imports vast amounts of “virtual water commodities” from Brazil, which is captured in the water footprint statstics explored in the next section.
And what about the UK? Although our WSI is relatively low, this statistic masks significant variation in regional water stress. The South East including London is particularly vulnerable to water stress. Some parts of England are already “over-abstracted” and if current trends continue it is likely that the UK will struggle to meet its water needs by 2050.
For a brief overview of the UK situation, see the Environment Agency’s report on Meeting our Future Water Needs (notably pages 3,4,8).
Exercise 12.2#
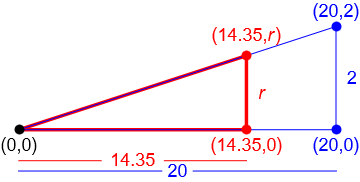
The score for the UK is easiest to calculate since this datapoint lies on the line passing through the origin.
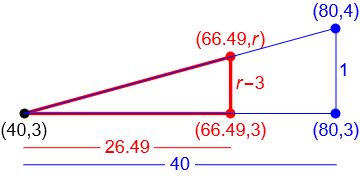
The score for India lies on the line connecting the point \((40,3)\) to the point \((80,4)\).
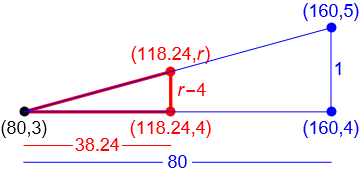
The score for Pakistan lies on the line connecting the point \((80,4)\) to the point \((160,5)\).
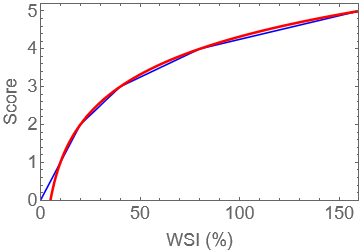
Side note: The coding scheme of the WRI does not actually use linear “pieces” to connect the data points as we did here. Instead, the data points are fitted using a curve:
A plot of this curve is shown in the image below, together with the “piecewise” fit that we have employed. The log function and data fitting techniques are discussed in chapters 3 and 4.
Exercise 12.3#
According to the given information, the world TFWW is around 3956 Gm3.
Of this figure,
The portion consumed by agriculture is around 35% of 69%
The portion consumed by industry is around 5% of 19%
The portion consumed by households is around 10% of 12%
Therefore in Gm3 the total consumed portion of TFWW (our global BWF) is around
This can be converted to a daily per-capita figure by dividing by the global population and the number of days in a year:
Note: Taking this to represent 11% of the total WF suggest that the global average daily per-capita WF is aorund 4000 litres.
To convert the UK annual BWF to a daily per-capita figure we divide by the UK population and the number of days in a year:
This figure seems to be extremely close to the global average. However, the UK is a net importer of “virtual water commodities” from other countries, and according to the results given in the paper, more than half of the UK’s blue water footprint was in areas of high water stress such as India and Pakistan.